Drawing boxplot with significance
在Python中绘制带有差异显著性的箱图,代码如下。
1
2
3
4
5
6
7
8
9
10
11
12
13
14
15
16
17
18
19
20
21
22
23
24
25
26
import seaborn as sns
import matplotlib.pyplot as plt
from scipy import stats
plt.rcParams['font.sans-serif'] = ['Arial']
plt.rcParams['font.size'] = 14
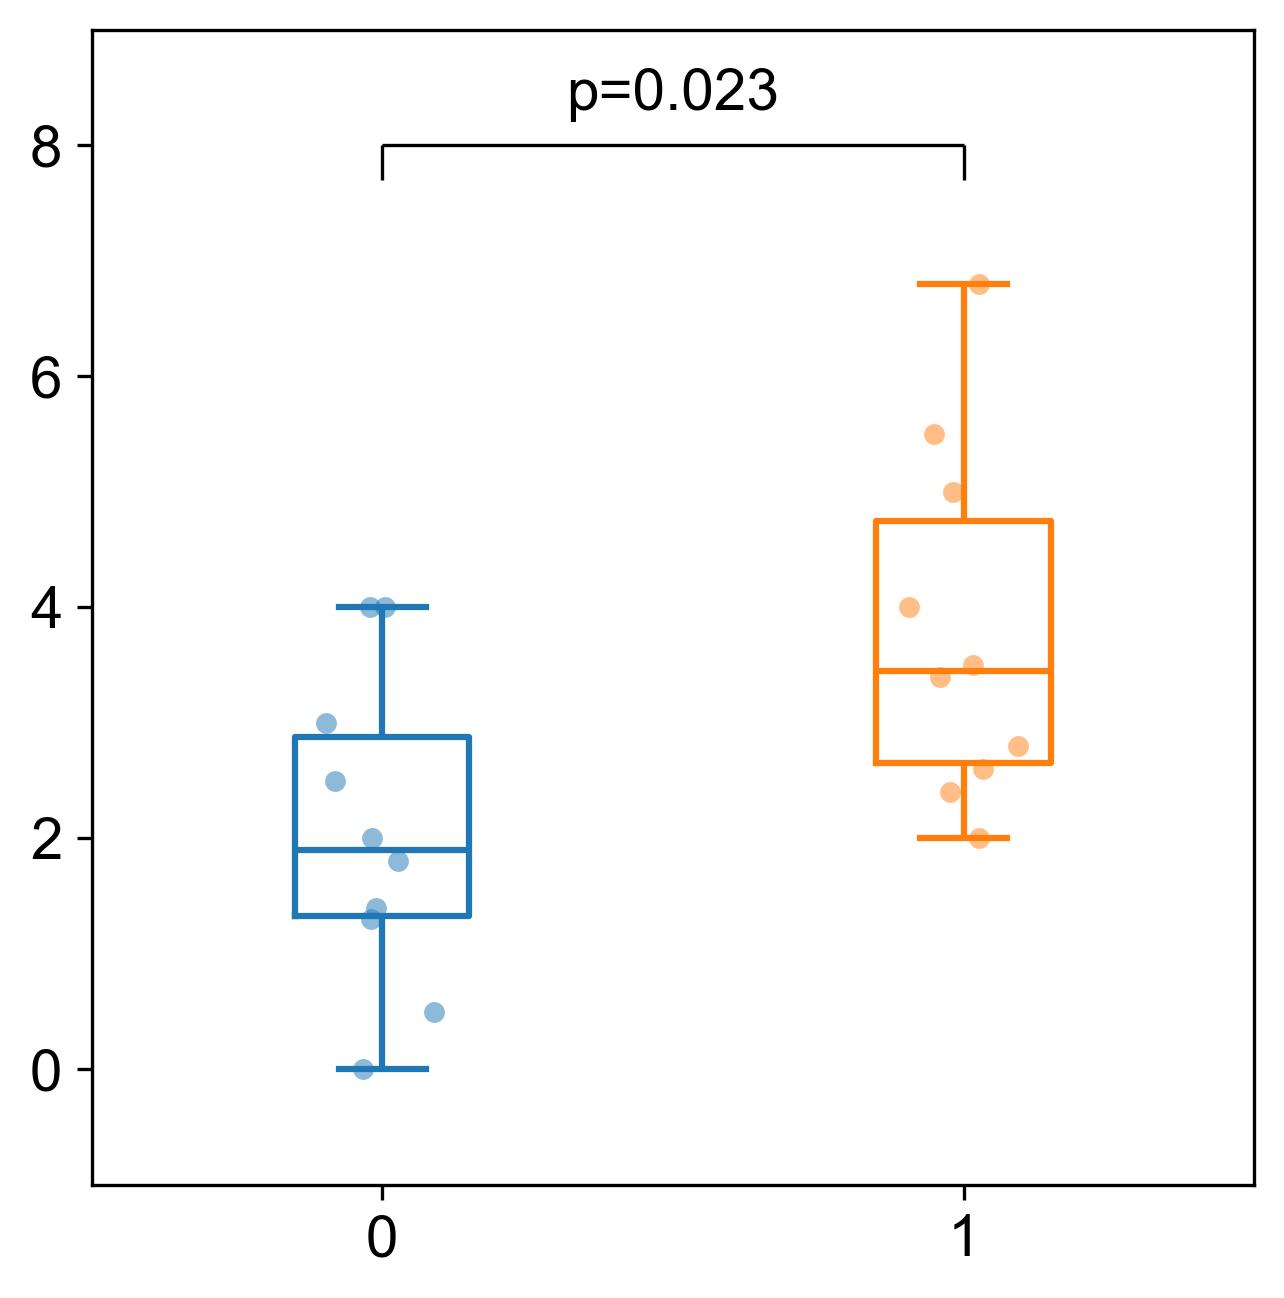
group1 = [0,0.5,1.3,1.4,1.8,2,2.5,3,4,4]
group2 = [2,2.4,2.6,2.8,3.4,3.5,4,5,5.5,6.8]
t_stat, p_value = stats.mannwhitneyu(group1, group2)
print(t_stat, p_value)
f,ax=plt.subplots(1, 1, figsize=(5,5))
sns.boxplot(x=0, y=group1, width=0.3, color='C0', fill=False)
sns.boxplot(x=1, y=group2, width=0.3, color='C1', fill=False)
sns.stripplot(x=0, y=group1, alpha=0.5, color='C0')
sns.stripplot(x=1, y=group2, alpha=0.5, color='C1')
line_y = 8
ax.hlines(y=line_y, xmin=0, xmax=1, color='k', lw=0.8)
ax.vlines(x=0, ymin=line_y-0.3, ymax=line_y, color='k', lw=0.8)
ax.vlines(x=1, ymin=line_y-0.3, ymax=line_y, color='k', lw=0.8)
ax.text(0.5, line_y+0.2, f'p={p_value:.3f}', ha='center', va='bottom')
ax.set_ylim(-1, 9)
ax.set_xlim(-0.5, 1.5)
可以得到下图结果。